

Azure Application Insights is a fully managed Azure Service that helps to monitor the application’s health in real-time. It allows us to track application availability, performance, user session. I have published several tips around application Insights, and here is a really quick and very helpful one. From the individual telemetry entry, you can pin entry to the chart telemetry chart, so that you can contrast trends of multiple entries.
Application Insights Telemetry Contrast trends using Pin Multiple Entry
Open the Application Insights, and go to any of the telemetry details – for instant Failures. The Failures in application insights shows all the failed calls along with dependencies and exception. It also displays all the corresponding operations.
Related Post: Export Azure Application Insights Data
Now, you can select and Pin multiple operations from the list of operations and perform a contrast trends analysis corresponding to total failed count and selected pined element.
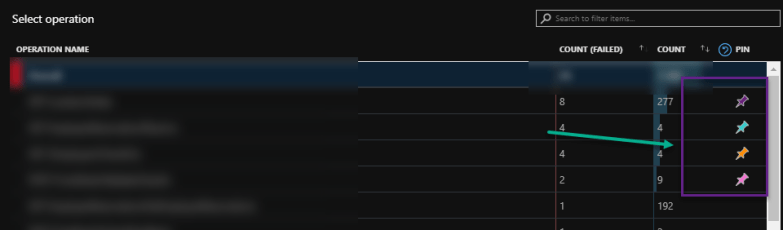
once operation items are pinned, you can see the failed operation graph added with all the elements x axis .

This is quite helpful feature to quick compare on services failed trends against other services.
Click on the Top “PIN” icon to reset all the pin items and the chart.


