You can add annotations in Application Insights Charts timeline. You can add it manually from the Application Insights Metrics explore. Annotation contains date time stamp, notes, and type indicator. Adding additional information as annotation may help review timeline across, also may be helpful for different members who is access the same chart information. You can add the annotations for the charts from the metrics explore.
Add annotations in Application Insights Charts
To add annotation, Open the respective Application Insights chart from the Metrics explorer. Select the chart, and click on the button “Add an annotation to the chart”

Click on the “Add an annotation to the chart” button will bring the “Add annotation” blade. Provide the Event date, time, name, comments, and label. The label used here as a graphical indication.

Click on ok to add the annotation in the chart. Once it is added, you can review the indication on the chart, and on mouse hover on it displays the comments and info provided during annotation creation.

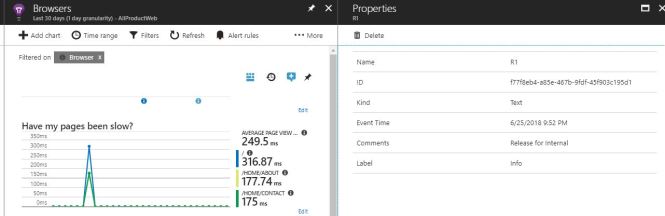
Selecting on the annotation tool till will take you to the details screen. From here, you can delete the annotation by clicking the delete icon.