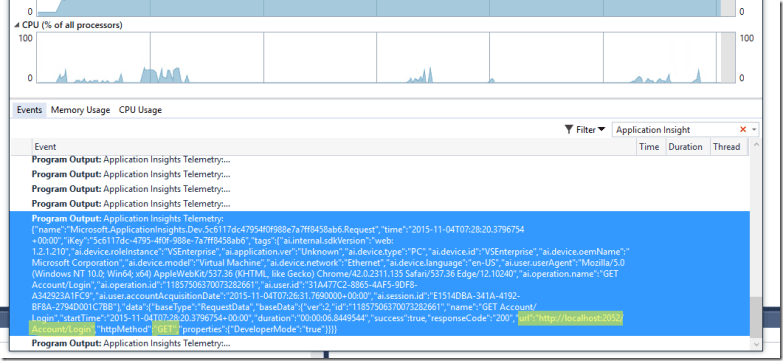
In Visual Studio, can get a detailed of the Application Insights events while you are debugging. To use this functionality, open the Diagnostic Tools window (Debug -> Diagnostic Tools). Along with other events, Application Insights events also trace inside the diagnostic tool.
Open the Diagnostic tool in Visual Studio while your Application Insights is on, you should be able to see the event trace as show in below. One mouse hover the application insights event details would be displayed.

Must Read : Searching Application Insights Data inside Visual Studio 2015
The Event Tab shows the all list of events, and you can do filter out of them – for an example filter on Application Insight to get list of all Application Insights traced events for the app.

You can navigate to specific event details from events list by just clicking through them.

Overall experience as remain same as other events, the added features is now you the events for Application Insights also tracked.
Hope this helps.


Pingback: Visual Studio – Developer Top Ten for Nov 9th, 2015 - Dmitry Lyalin
Pingback: Links i found interesting the last week! - Magnus Udbjørg
Pingback: 12-11-2015 - Links - Magnus Udbjørg
Pingback: Application Insights Events Filtering inside Visual Studio Diagnostic tools