Getting the performance information is now in your finger tip and you can inspect this information during debugging itself using the PerfTips feature. Run you application in debug mode, and step through the lines by F10. You should be to able see the time elapsed during the execution of previous statement. This feature is enabled by default. In case it is not showing up, you must check if it is enabled or not.
Here is a snippet that shows PerfTips for elapsed time.

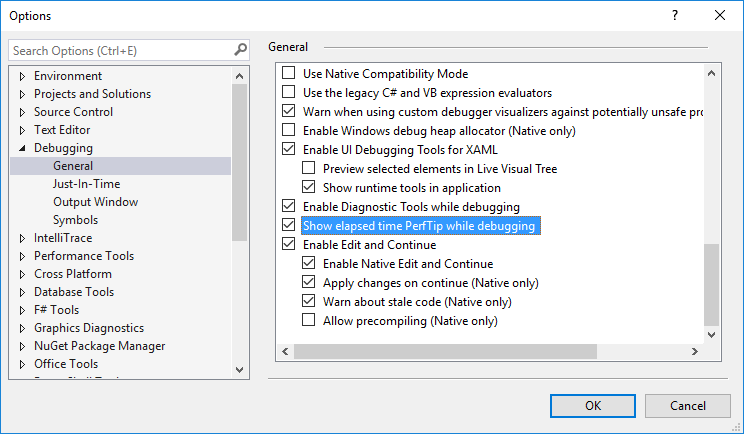
If you don’t see the elapsed time is appearing during debugging you must recheck if it is enabled or not.
Related Post : How To customize PerfTips Colors in Visual Studio 2015 ?

Navigate to Tools –> Options –-> Debugging –> General, and then Checked the “Show elapsed time PerfTip while debugging”

With the option selected, the Visual Studio IDE will start showing up the PerfTip time elapsed during debugging.
Hope this helps.


Pingback: Dew Drop – March 11, 2016 (#22060 | Morning Dew
Pingback: Visual Studio – Developer Top Ten for Mar 17th, 2016 - Dmitry Lyalin