Use code>DebuggerBrowsable attribute to customize the debugging windows
Use DebuggerDisplay attribute to customize the debugging display.

To use above attributes you have to use System.Diagnostics namesapce
1. Using DebuggerBrowsable Attributes
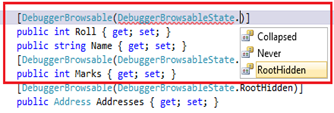
If you want to customize the view on debugger window for any properties during debugging you can easily do it using DebuggerBrowsable attributes. You can apply this attributes for any properties, fields or for Indexer. DebuggerBrowsable attributes constructor takes DebuggerBrowsableState as argument. DebuggerBrowsableState is used to provide the instruction to debugger that how it going to be display in debugger window.
We can provide three state for DebuggerBrowsable attributes.
1. Collapsed :  If we set DebuggerBrowsableState as collapsed, then debugger window will show the element as collapsed. it’s the default behavior.
2. Never : It will never show the element in debugging window.
3. RootHidden : It will hide the root elements and display the all child items as expanded view.
You can read the complete definition of these DebuggerBrowsableState at MSDN
Now I am going to demonstrate the use of this DebuggerBrowsable Attributes and DebuggerBrowsableState using a example.
Before starting, Let’s consider we are having the following code block.
namespace DebuggerDemo
{

/// <summary>
/// Student Info Demo Class
/// </summary>
class Program
{
/// <summary>
/// Mains the specified args.
/// </summary>
/// <param name="args">The args.</param>
static void Main(string[] args)
{
List<Student> student = new List<Student>();
student.Add(new Student { Roll = 1, Name = "Abhijit", Marks = 87, Addresses = new Address { Address1 = "add1", Address2 = "add2" } });
student.Add(new Student { Roll = 2, Name = "Abhishek", Marks = 41, Addresses = new Address { Address1 = "add3", Address2 = "add4" } });
student.Add(new Student { Roll = 3, Name = "Rahul", Marks = 67, Addresses = new Address { Address1 = "add5", Address2 = "" } });
student.Add(new Student { Roll = 4, Name = "Sunil", Marks = 91, Addresses = new Address { Address1 = "add11", Address2 = "add122" } });
student.Add(new Student { Roll = 5, Name = "Atul", Marks = 71, Addresses = new Address { Address1 = "add12", Address2 = "add222" } });
student.Add(new Student { Roll = 6, Name = "Kunal", Marks = 71, Addresses = new Address { Address1 = "add12", Address2 = "add222" } });
}
}

/// <summary>
/// Student Class
/// </summary>
class Student
{
/// <summary>
/// Gets or sets the roll.
/// </summary>
/// <value>The roll.</value>
public int Roll { get; set; }

/// <summary>
/// Gets or sets the name.
/// </summary>
/// <value>The name.</value>
public string Name { get; set; }

/// <summary>
/// Gets or sets the marks.
/// </summary>
/// <value>The marks.</value>
public int Marks { get; set; }

/// <summary>
/// Gets or sets the addresses.
/// </summary>
/// <value>The addresses.</value>
public Address Addresses { get; set; }
}

/// <summary>
/// Address of Students
/// </summary>
class Address
{
/// <summary>
/// Gets or sets the address1.
/// </summary>
/// <value>The address1.</value>
public string Address1 { get; set; }

/// <summary>
/// Gets or sets the address2.
/// </summary>
/// <value>The address2.</value>
public string Address2 { get; set; }
}
}
Now, first let’s see, how the normal debugging window behaves. Just put a breakpoint at the end of main method and try to explore the debugging window, you will get debugging window as below picture, which is the expected debugging window view.
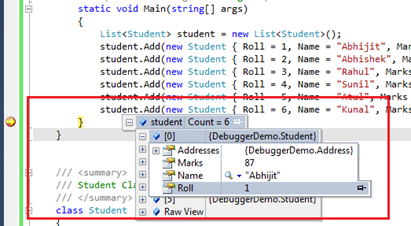
In the above picture you can see, we are having 6 student object and each one having different value. As Addresses is a different class and used as properties with multiple value, hence it is in the collapsed mode.
Now, I want to see all the address along with all other properties with expanded mode and also want to hide the Marks properties. To achieve the above requirement we have to add DebuggerBrowsable attrributes for the Marks and Addresses properties in the Student class

Now if you put the breakpoint in the same location and explore the debugging window you will find the debugging window view as below picture
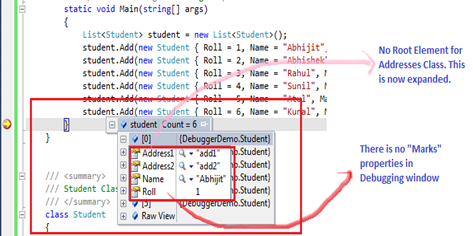
So, from the above picture you can easily identify the changes in the debugging window view.
2. Use DebuggerDisplay attribute
Here is the second tips. By using DebuggerDisplay attributes you can define how a class or field will be displayed in the debugger window. using DebuggerDisplay you can change the debugger window message and variables that you want to display.
If you consider the above code sample and debug the application, by default you will get the below snaps of debugging

Here, for each student object you are getting NameSpace.ClassName as display mesaage by default. Now we can customize the display using DebuggerDisplay attributes. DebuggerDisplay attributes constructors take display name as arguments or you can passed named parameter that you to display over there.

After made the above changes if you run the same code you will find that custom display message with proper value of parameter that you have given in debuggerdisplay attributes.
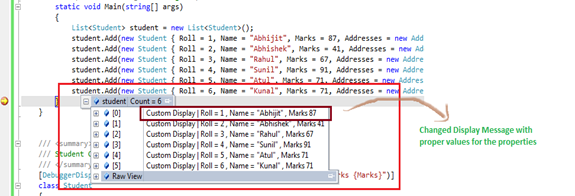
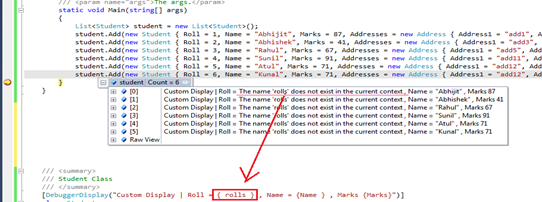
Note: While using DebuggerDisplay, you have to make sure that you are giving proper field name as argument with in { }. Other wise you will get message like below.
In this post I have explained how we can customize the debugging window’s view during debugging of our application using DebuggerBrowsable and DebuggerDisplay attributes. This is quite helpful while you are debugging a complex object and you want to make your debug window very simple.



Pingback: SHRAVAN Weblog » 14 Useful .NET Debugging Tips & Tricks in Visual Studio
Pingback: 10 Effective Debugging Tips for .NET Developer