By Marking a piece of code using DebuggerStepThrough attribute tells the Visual Studio debugger that, the code block will be stepped over from debugging process. you can mark methods, properties with DebuggerStepThrough attributes where you don’t want to stop your code to break.
If there is any break point inside a code section which is marked as “DebuggerStepThrough” attributes, that code block will be marked as “[External code]” in stack Trace. Where as “Debugger hidden” attributes didn’t marked is External code.
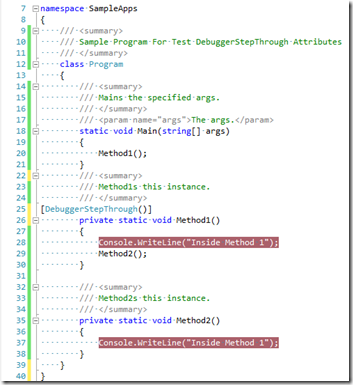
Let’s assume that you have the below sample code snippet where “Method1()” marked as with debuggerStepThrough() attributes.
Now if you run your application, debugger will stop at line number 37 inside Method2() [ Note : Line number I am using only for reference of that above code ], though you have a break point at Line number 20, inside method1(). But, as Method1() has marked as “DebuggerStepThrough”, the breakpoint didn’t hit over there.
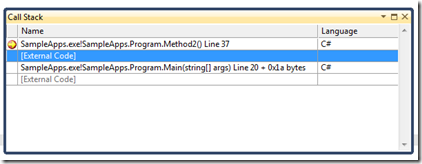
While the breakpoint stopped at the method2(), just open the call stack window as shown in below
As per the about Call stack window, Live breakpoint position is Line number 37 which is inside the Method2(), and method2() has been called from method1(). Though the method1() having a break point, it doesn’t hit due to “DebuggerStepThrough” attributes.
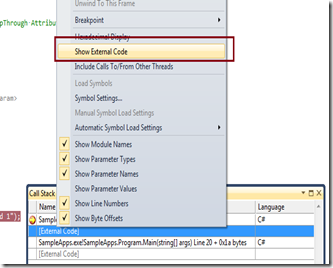
The breakpoint position of method1() has been marked as “[ExternalCode]” . To make it sure, just right click on “Call Stack” window and select “Show External Code” option.
This change will show you exact line from where it has been called which is marked as “External Code” . Below screen shows the exact line of call for the external code which was marked as “DebuggerStepThrough”
Once you select the “Show External code” option, you can see the exact line number from where the method2() was called. You can also verify the same by just clicking one the line at the call stack window.
You can apply the “DebuggerStepThrough” attributes with properties also. But for that, you have to apply the attributes to get and set statement not with the properties name.


Pingback: SHRAVAN Weblog » 14 Useful .NET Debugging Tips & Tricks in Visual Studio